
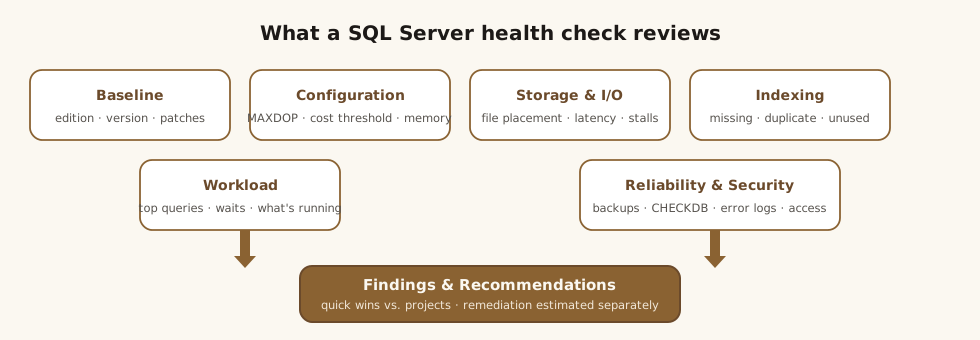
Every engagement starts the same way: "the server is slow." No error, no repro, no numbers — just a database that used to be fine and isn't anymore. A SQL Server health check turns that into something you can act on: a documented review of the whole instance, measured against Microsoft best practices, that ends in a prioritized list of findings and recommendations.
This is what I actually review, and roughly why. It's a discovery pass — an hour or two per server — not a remediation. The point is to find what's wrong and rank it, so the fixes that follow are the ones that matter most. Everything here uses what ships with SQL Server plus one free community script I'll credit. I'm not going to walk through every query line by line; the value is knowing what to look at and why it matters, which is exactly what a good report captures.
If you'd rather hand it off, this is precisely the scope of a fixed-scope SQL Server health check.
Server and instance baseline
Before performance, establish what you're standing on. A surprising number of "slow server" problems are really "wrong server" problems.
- Edition and version — is the build still in support, and is it patched to a recent cumulative update? An unsupported or badly out-of-date build means no security fixes and known bugs left unpatched.
- Compatibility level — a mismatch here is behind a lot of "it got slow after we upgraded" tickets (see the migration playbook).
- Instance facts — collation, clustered/HADR status, processor count, default data and log paths, and the last restart date (a server that was rebooted an hour ago has empty caches and lies to you).
- Services and service accounts — which services are enabled and what identities they run under. This overlaps with security and is a common audit gap.
Instance configuration that quietly taxes everything
A handful of settings tax every query on the box until someone looks. These are cheap to check and often the fastest wins in the whole report:
- Cost threshold for parallelism — the default of 5 dates to the 1990s and is almost always too low, so trivial queries go parallel and generate
CXPACKETwaits. - MAXDOP — set to match the hardware and workload, not left at 0 by default on a large NUMA box.
- Max server memory — capped so SQL Server isn't fighting the OS for every gigabyte.
- Optimize for ad hoc workloads, instant file initialization, backup compression, and sane auto-growth (fixed size, not percent) round out the usual list.
- Recovery models — is each database's recovery model actually aligned to its backup strategy and RPO, or is a "full recovery" database quietly never having its log backed up?
None of these are exotic. They're just the settings that inherited instances almost never have set correctly.
Storage, file placement, and I/O latency
Storage is where "the server is slow" most often turns out to be true, and it's the part teams check least.
- File placement — data, log, and tempdb ideally on separate, appropriately-provisioned storage. On modern SANs and VMs this matters less than it used to (the "separate spindles" logic is largely gone), but it's still worth knowing how the files are laid out and whether tempdb is sharing with everything else.
- Tempdb — enough equally-sized data files, no allocation-page contention. Tempdb gets its own section below because it earns it.
- VLFs — a transaction log grown in tiny increments over years can accumulate thousands of virtual log files and slow startup, recovery, and log backups (Kimberly Tripp's SQLskills work on transaction-log/VLF architecture and tempdb is the standard reference).
- Disk latency and I/O stalls — this is the measurement that settles storage arguments.
sys.dm_io_virtual_file_statsreports cumulative read and write stalls per file, so you can see exactly which database (and which file) is waiting on storage and by how much. Capturing those stalls as deltas over a window — Paul Randal's SQLskills approach, which tools like dbatools'Get-DbaIoLatencybuild on — is the difference between "storage feels slow" and "the log file on drive X is averaging 30 ms writes."
Tempdb, done right
Tempdb deserves its own look because so much passes through it — sorts, hashes, version store, temp tables. The checklist is short: multiple equally-sized data files, pre-sized so they aren't auto-growing under load, isolated from the user databases where practical, and free of the PFS/GAM/SGAM allocation contention that shows up as PAGELATCH waits. Modern installers set this up reasonably; older, upgraded instances frequently don't.
Indexing overview
Indexing is reviewed for four things, in order of real impact:
- Missing indexes on hot lookups — the biggest lever, drawn from the missing-index DMVs and (more reliably) from the top queries themselves.
- Duplicate and overlapping indexes — dead weight that slows writes and wastes space.
- Unused indexes — same cost, no benefit.
- Fragmentation — genuinely the least important of the four; it's overrated as a health signal, and chasing it is rarely where the wins are.
The workload: top queries, waits, and what's running
Three views of what the server is actually spending its time on:
- Top expensive and longest-running queries — the handful of statements responsible for most of the CPU, reads, and duration. Query Store (2016+) is the fastest way to rank these and to catch a query that recently regressed, often from parameter sniffing.
- Wait statistics — what the server is starved for as a whole (CPU, I/O, memory grants, locks). Paul Randal's SQLskills reference on which waits are benign and which to chase is the standard filter to use here.
- What's running right now — for live blocking and activity, Adam Machanic's free
sp_whoisactiveshows the running sessions, their blocking relationships, and their SQL in one readable result set. Chronic lock waits point at blocking and deadlocks.
Reliability, maintenance, and security
Finish where an outage would start:
- Backups — are they configured, actually completing, and restorable? An untested backup is a rumor. Check backup history and the last clean
DBCC CHECKDB. - Maintenance — index and statistics maintenance, and cleanup of history/backup files so the server isn't slowly filling its own disks.
- Error logs — a quick read of the SQL Server error logs surfaces recurring failures, login problems, and I/O warnings that never made it into a ticket.
- Alerts and operators — is anyone actually being told when severity 17–25 errors or job failures happen?
- Security pass — database users and roles, sysadmin sprawl, and which identities the services run under.
The deliverable
A health check should end in a short, ranked document: the findings, the evidence for each, and clear recommendations — quick config wins separated from the projects (a tempdb rework, a storage fix, an HA gap). Remediation itself is a separate step, estimated from the findings, not bundled into the discovery. That keeps the assessment honest: first we agree on what's wrong, then we decide what's worth fixing.
If you want that run on your environment and written up, that's what I do. See SQL Server DBA services, review real client results, or get in touch.
References
sys.dm_io_virtual_file_stats— measuring I/O latency and file stalls — Paul S. Randal, SQLskills: "How to examine IO subsystem latencies from within SQL Server." How to examine io subsystem latencies from within sql server — Paul Randal, SQLskills · Microsoft Learn: Sys dm io virtual file stats — Microsoft Learn- Tempdb configuration, VLFs & transaction-log architecture — Kimberly L. Tripp, SQLskills. Kimberly Tripp — SQLskills
- Wait statistics reference (which waits to ignore) — Paul S. Randal, SQLskills. Wait types library — SQLskills
- sp_whoisactive — Adam Machanic. sp_whoisactive (whoisactive.com) · sp_whoisactive on GitHub
- Query Store — Microsoft Learn. Monitoring performance by using the query store — Microsoft Learn