
Blocking and deadlocks are the two problems most likely to get a DBA paged, and the two most likely to be "fixed" the wrong way. Both are lock-related, but they are not the same thing, and the popular quick fix — sprinkling NOLOCK everywhere — treats a symptom while quietly introducing wrong results.
This is a root-cause method: how to tell blocking from deadlocks, how to trace each back to what's actually causing it (usually indexing or transaction design), and how to fix it so it stays fixed.
Blocking vs. deadlocks: the difference
Blocking is normal in small doses. Session A holds a lock; session B wants the same resource and waits. When A commits, B proceeds. It only becomes a problem when waits get long or a chain forms — B waits on A, C waits on B, and throughput collapses.
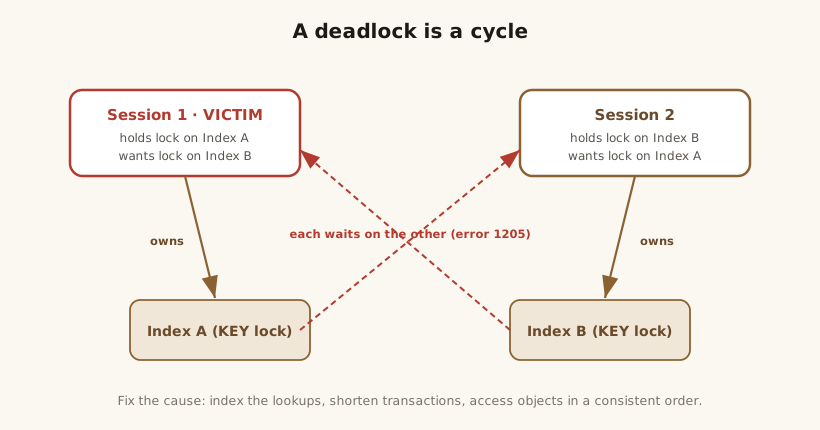
A deadlock is different in kind: two (or more) sessions each hold a lock the other needs, forming a cycle no amount of waiting resolves. SQL Server detects the cycle and kills one session as the deadlock victim (error 1205), rolling it back so the other can proceed.
And about NOLOCK: it's READ UNCOMMITTED, which doesn't take shared locks — so it avoids the wait by reading dirty, uncommitted data. That can return rows twice, skip rows entirely, or show changes that later roll back. It is not a correctness-safe fix for blocking, and reaching for it is almost always a sign the real cause hasn't been found.
Reading a deadlock graph
You rarely have to reproduce a deadlock to diagnose it, because SQL Server already captured it. The always-on system_health Extended Events session records deadlock graphs by default; you can also stand up your own XE session. (The old trace flags 1204/1222 still work but the XE graph is far easier to read.)
A deadlock graph has three parts worth reading:
- Process nodes — the sessions involved, each with the statement it was running and the transaction it held.
- Resource nodes — what they were fighting over (KEY, PAGE, or OBJECT locks), and which index/object each belongs to.
- The cycle — the ownership-vs-request arrows that form the loop, plus the session marked as victim.
Read which statements and which indexes are in the cycle — that's what points you at the fix.
Finding the head of a blocking chain
For live blocking, the DMVs tell you who's waiting on whom:
SELECT
    r.session_id,
    r.blocking_session_id,
    r.wait_type,
    r.wait_time,
    r.command,
    t.text AS running_sql
FROM sys.dm_exec_requests AS r
CROSS APPLY sys.dm_exec_sql_text(r.sql_handle) AS t
WHERE r.blocking_session_id <> 0
ORDER BY r.wait_time DESC;
Follow blocking_session_id up the chain until you reach the lead blocker — the session that's blocking others but isn't itself blocked. That session, and what it's doing (or not doing — an open transaction sitting idle), is your target. sys.dm_os_waiting_tasks and sys.dm_tran_locks fill in the lock detail.
In practice, the fastest way to see all of this at once is Adam Machanic's free sp_whoisactive, which surfaces the running sessions, their blocking relationships, and their SQL in a single, readable result set.
Common causes
Blocking and deadlocks almost always trace back to a short list:
- Missing or poor indexes. Without a supporting index, a query scans, which locks far more rows and holds those locks longer. Good indexes are the single most effective blocking fix.
- Long transactions. A transaction that stays open across user "think time," a slow external call, or a chatty loop holds locks the whole time.
- Wrong isolation level or lock escalation. Higher isolation holds locks longer; once a single statement acquires roughly 5,000 locks on one object, SQL Server escalates row/page locks to a table lock and blocking spikes.
- Inconsistent object access order. Two procedures that touch tables A and B in opposite orders are a textbook deadlock recipe.
Fixes that hold up
- Index the lookups so locks are precise and brief — this resolves a surprising share of "blocking" problems outright.
- Shorten transactions. Begin late, commit early, and never hold a transaction open across a user interaction or a remote call.
- Access objects in a consistent order across procedures to break deadlock cycles.
- Consider Read Committed Snapshot Isolation (RCSI) so readers don't block writers and vice versa — powerful, but understand the tempdb version-store cost before flipping it on a busy system. (RCSI changes the statement-level read-committed default; full Snapshot Isolation is opt-in per transaction — related, but not the same knob.)
- Set
DEADLOCK_PRIORITYon low-value background work — a cleanup job or a report — so it, rather than the paying OLTP transaction, is chosen as the victim when a deadlock is truly unavoidable. - Add retry logic for deadlock victims (catch error 1205 and retry the transaction) as a belt-and-suspenders measure, not a substitute for fixing the cause.
Preventing the next one
Make it visible: alert on deadlock counts and on blocking that exceeds a threshold, and baseline both so you notice a trend before it becomes an incident. Deadlock and blocking checks are a standard part of a SQL Server health check.
Chronic blocking and deadlocks are almost always a solvable indexing-or-transaction problem, not a fact of life — and definitely not a reason to litter the code with NOLOCK. It's core performance tuning work; review client results or get in touch.
References
- sp_whoisactive — Adam Machanic. Free activity-monitoring stored procedure. sp_whoisactive (whoisactive.com) · sp_whoisactive on GitHub
- Deadlocks & the system_health session / deadlock graphs — Microsoft Learn. Sql server deadlocks guide — Microsoft Learn
- Transaction locking and row versioning (RCSI) — Microsoft Learn. Sql server transaction locking and row versioning guide — Microsoft Learn